The Revenge of Demographics

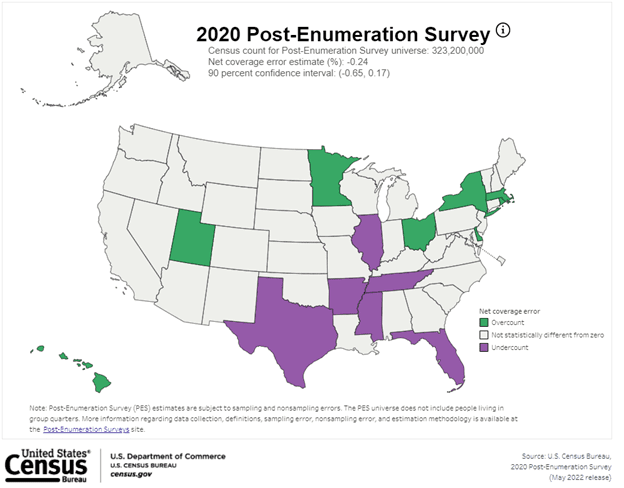
What happens when the target demographics of your marketing campaign are … wrong? Well, now you can blame the U.S. Census Bureau. In the Post Enumeration Survey, the Census Bureau reported under and over counts for each state. The results are as follows:
- 37 states (or state equivalents) did not have estimated statistically significant undercounts or overcounts.
- 14 states (or state equivalents) are estimated to have had an undercount or overcount – a net coverage error statistically different from zero – meaning they were either undercounted or overcounted:
- Undercount: Arkansas (-5.04%), Florida (-3.48%), Illinois (-1.97%), Mississippi (-4.11%), Tennessee (-4.78%) and Texas (-1.92%).
- Overcount: Delaware (+5.45%), Hawaii (+6.79%), Massachusetts (+2.24%), Minnesota (+3.84%), New York (+3.44%), Ohio (+1.49%), Rhode Island (+5.05%) and Utah (+2.59%).
According to a report in the Wall Street Journal, the 2020 Census missed 0.24% of the entire U.S. population, but also overcounted homeowners by 0.4%, and undercounted renters by 1.5%. Children under 5 were undercounted by 2.8%, men over 50 overcounted by 0.6%, and women over 50 undercounted by 2.6%.
The upshot? Not much. There will be no restating of the U.S. Population and no changes made to Congressional reappointment. Again, according to the WSJ:
Nationwide, the 2020 census missed about 0.24% of the U.S. population, or about three-quarters of a million people, the bureau reported in March. The overall margin wasn’t statistically significant, but many groups were miscounted at significant rates. About 3.3% of Black people were missed, as were 5% of Hispanic people and 0.9% of American Indians and Alaska Natives. By comparison, non-Hispanic whites were overcounted by 1.6% and Asian-Americans by 2.6%.
Let’s put aside the issue of overall statistical significance at the state level but raise the concern that individual ethnic segments were miscounted. This makes the job of marketers more difficult at a time when using standard Census geographies may be considered too large because mobile movement data has provided more granular details at a city block or street intersection level.
So, how to use census data for market research? This piece of information is no longer enough and marketers need to look for ever more detail on footfall movement data, dwell time, and the frequency by which consumers are in proximity to certain brands or retailers. This provides the data to develop ever finer audience segmentations that feed mobile advertising, retail site selection, and even banking patterns. However, footfall data alone is not a panacea, and in fact, as privacy controls instituted by Apple’s iOs have rippled through social media, utilizing mobile movement data alone is not the answer either.
This is painful for marketing organizations, especially when they expected that more high-frequency mobility data would be able to quickly segment and identify consumer trends at a micro-geographic level. When it is not possible to act quickly and pivot to audience preferences, marketing campaigns fail. We have seen this in the first quarter of 2022 when Walmart and Target missed their revenue targets because their in-store merchandise did not meet customer demand, in addition to inflationary pressures. Investors are looking at Best Buy’s footfall traffic as a leading indicator of whether consumer spending is falling off a cliff.
So, if Census geographies are suspect and mobile movement data are subject to limited geographic extents and privacy, what’s the answer? The answer is to use both. Recently, two companies have begun to promote products that leverage the underlying rich attribution of demographic data analysis with the frequency of mobility.
Precisely launched Dynamic Demographics, combining both local demographic data with mobile movement data. According to the company:
Precisely already had a rich portfolio of location data, including boundaries and demographics of the people living in specific areas. This is anonymized; with the addition of equally anonymized mobile data, organizations will better understand how target audiences move around depending upon the time of day, day of the week, or public holidays.
Environics Analytics offers MobileScapes USA, which assigns mobile movement data to ZIP+4. MobileScape Trend reports offer data in conjunction with PopFacts, which “consists of over 4,700 demographic variables based on the latest available U.S. Census and American Community Survey (ACS) data.” The objective is to observe daytime vs. nighttime variability of population movement.
Combining new Census data with mobility data offers the best of both while maintaining a level of privacy that may be most concerning to both citizens and marketers alike. It provides a new tool that marketers can use to do more precision targeting.
In support of better precision, Applied Geographic Solutions (AGS) offers support for the 2020 Census geographies as it notes that the Census Bureau has paid considerable attention to the “deficiencies” that have beset census geography. AGS notes that:
At the block level, substantial change has occurred that actually reduced the total number of blocks by several million. While adding blocks in growth areas, the main benefit of the change is the reduction of the number of unpopulated blocks that were created to stitch together the county-level files (sliver polygons) and to make the application of the guidelines more consistent…Our overall assessment of the 2020 block and block group geography levels is that it is a vast improvement over the previous generations, largely because of the consolidation of blocks in rural areas, the removal of many tiny water blocks, and the elimination of most of the sliver/gap polygons along county and state lines.
Counting people, especially during the COVID pandemic, was especially challenging and there were bound to be inconsistencies in data collection. But the Census Bureau has offered transparency on the process, and private companies are looking to compensate with some of the under or over counts by adding more high-frequency mobile movement data. So, it’s not time to throw away that census data just yet…just be aware of the good data that it has collected and the additional value of mobility data to enrich it.
Is that the answer? Just be aware of “possible” inconsistencies? The remaining problem lies in taking what we have from each data vendor, calibrating for the changes seen in the Census, and developing the best possible market trends with spatial statistical analysis. This is how Korem is providing value to our customers. We work with a comprehensive portfolio of vendors and appreciate the changes they are making to correct the demographic data analysis. We add the expertise that our customers have come to expect from Korem so they don’t have to keep track of each vendor’s changes or their licensing policies. That’s why we believe we are the best one-stop shop for geospatial technology and data.
