Traffic Analytics in the Banking Industry for Financial Planning and Forecasting
The banking industry has undergone several radical changes over the past few years. Currently, banks are putting a lot of effort to implement a digital approach as part of their omnichannel strategy, which has pushed them to rethink online and on-site services. Following the 2008 financial crisis, the banking industry began a first wave of closures, starting with the least profitable and effective branches, in order to maximize their energy and investments. It’s no surprise that the pandemic has also impacted customer habits, significantly changing traffic trends with the introduction of compulsory remote working in several sectors.
The gradual return to the office and the increasing popularity of online services together raise a number of questions with respect to physical branch networks and what the future might hold for them. All the same, even if most banking needs can be met entirely remotely via smart devices, some customers still prefer to access certain services in person.
In view of this, wouldn’t it be better to have fewer branches and thus optimize their efficiency? Often, the answer is YES. Mobility data, which combines footfall data and traffic data, and traffic analytics are thus a particularly useful and precise financial forecast method, improving business intelligence, and understanding customer behaviors. Ultimately, all these advantages mean that banks will be able to make more informed—and therefore better—decisions regarding opening or closing branches.
Advantages of Mobility Data and Traffic Analytics in Banking
1. Forecast Financial Performance
Comparing daily and hourly variations in road traffic makes it easier for financial institutions to follow week-on-week changes in terms of business performance, and better understand the seasonality of local and hyperlocal sales. Mobility data also makes it possible to understand patterns of traffic around the sites, as well as any obstacles or road closures that might negatively impact the performance of a potential or existing branch.
Analyzing traffic volumes and frequency of visits is also useful when it comes to measuring a bank’s reputation and appeal, and those of its brand. There’s no doubt that when a bank really appeals to the general public it can expect to see increased traffic in its branches. All in all, a strong brand image and judicious site selection are key elements of any financial institution’s success.
2. Carry Out Business Intelligence
Mobility data offers a powerful advantage when it comes to finding out more about rival branches and better understanding their choice of locations. There’s a reason why financial institutions tend to cluster together in the same district, preferably near other retailers like drugstores, grocery stores, restaurants, and filling stations. It’s a phenomenon called “agglomeration,” and it is a significant contributor to many companies’ retail location strategies because it helps them to take advantage of footfall in nearby stores.
Not only that, but mobility data allows banks to analyze the positive or negative effects that external factors, such as road traffic, nearby stores, and physical obstacles, have on their competitors’ performance. Banks can then confidently use the data to make more informed decisions regarding their own branches. In fact, 92% of investment organizations, from hedge funds and private equity to venture capital, use geospatial data to inform all kinds of decision-making.
3. Understanding Customer Behaviors
Traffic analytics make consumer trends and customer demographics easier to understand because it takes into account not just traffic volumes, but a customer’s point of departure (origin) and arrival (destination) too. The data can then be used to estimate how far they’ve traveled and how long it took them to get to the branch in question, which in turn makes it possible to assess its reach. It can even explain any unusual customer journeys.
What’s more, banks that still want to increase footfall, despite the increasing popularity of online services, will have no choice but to redefine the spaces in their branches, finding out what type of customer seeks in-person banking services, how far they travel, and how long they stay. Then they will be able to adjust the in-person services offered and improve the overall customer experience.
For instance, they might decide to add more ATMs, kiosks, trucks, and drive-through lanes or integrate virtual wallets into the traditional banking experience. In this instance, mobility data can help banks understand where the best foot traffic is. These types of services allow banks to differentiate themselves from their competitors.
Using Mobility Data and Traffic Analysis for Financial Decisions about Branches
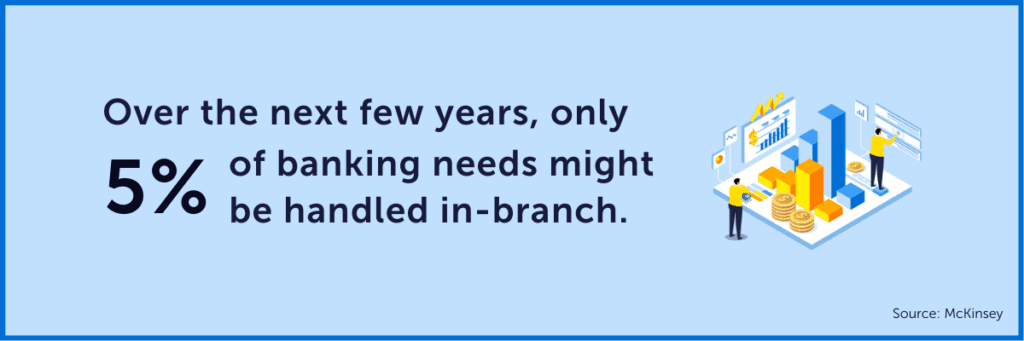
At the moment, a number of financial institutions are thinking about the best way to redistribute their resources and make sensible, informed financial decisions about investing in digital technologies or real estate. Some banks have even begun the next round of branch closures. Decisions about the location of each branch are usually based on what’s available and influenced by real-time data regarding market opportunities, traffic patterns, competition, and customer behaviors. Physical convenience often turns out to be the determining factor with respect to retail outlet density. However, according to a McKinsey report, the percentage of banking needs handled in-branch might dwindle to only 5% over the next few years.
“Ultimately, branch visits will be infrequent and focused on advice and issue resolution — just like a twice-yearly visit to the phone store.”
– Novantas
Yet even despite the drop in branch footfall and the advent of digital channels, there will always be a need for brick-and-mortar locations, particularly in regard to high value-added activities. For example, accounts opened digitally have a first-year retention rate of just 50%, compared with 80% for accounts opened in-branch.
Owing to what’s happening in the market, tools for tracking real-time footfall and vehicle traffic will be increasingly vital, because they provide contextual and historical data about customers and their local travel habits. Combining data with location-based data and demographic data will provide banks with a complete profile of the customers in a particular area and their needs. Once the data has been extracted and turned into a usable format, financial institutions can then design informative dashboards that help them concretely visualize how their branches perform in relation to fluctuating traffic flows.
Such information has a key role to play in determining which products or services to offer in which branch and which areas to target in terms of opening and closing branches. Ideally, the site selection process should involve the team that makes real estate decisions working alongside the marketing group in performing geographical analyses in order to develop planning models using data about existing sites. This would be a time-saver for the planners, as they would not have to visit potential sites for new branches or draw on maps by hand. Conversely, where branches are to close, banks must strive even harder to get customers in these areas to engage with them digitally.
Choosing the Most Effective Traffic Data Integration Solution
Mobility data has to become commonplace in the banking sector if financial institutions are going to be able to conduct effective footfall analysis. But they don’t always know where to start looking for a supplier and don’t always have the necessary data integration tools, human resources, or equipment to successfully make the most of raw data.
This means it’s impossible for most organizations to obtain quality data and then perform data integration and data enrichment using a conventional GIS without the help of a company offering an excellent level of skills in geospatial data and cloud storage technology. What’s more, mobility data is extremely voluminous, making it even more imperative to adapt a company’s—frequently inadequate—IT data integration systems so that processing capacity can be optimized, thus ensuring high output. This is where Korem comes in, with its Data as a Service offer (DaaS) and cloud computing platforms, helping businesses to easily overcome such data issues.
We invite you to watch our webinar How to Predict Branch Success in a Digital-First World, a complementary resource to this article, to learn how:
- Location-based data supports a hyperlocal view of branch success;
- Trade areas are defined by correlating high-fidelity, daily auto or pedestrian traffic;
- Using geospatial data supports audience segmentation and brand awareness.
